The National Survey of Academic Researchers: New Facts and Data
AI-generated summary. The summary and Q&A on this page were generated by AI, with limited human editing. Please refer to the paper for the full results and interpretation.
The paper in brief
Researchers differ in how they spend time, earn income, and pursue research.
A survey of professors at major U.S. research institutions documents features of academic work that grant and publication records often miss. Earnings vary more within fields than across them. Accounting for research hours changes some productivity rankings. Research risk-taking is related to fundraising, personal risk preferences, and the kinds of questions researchers pursue.
4,388 professors
Completed the survey, conducted from October 2022 to March 2023.
158 institutions
In the target population, selected by total research and development spending.
0.69 correlation
Between publication output per year and per reported research hour in the matched sample.
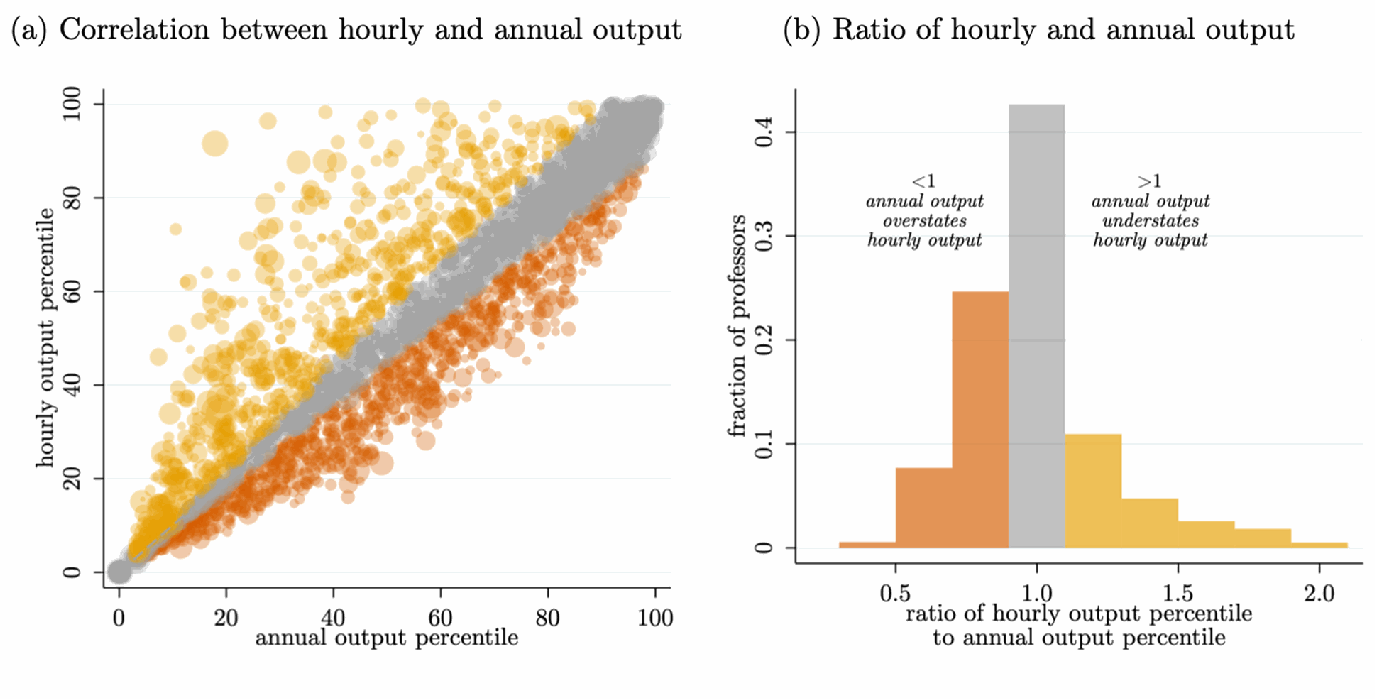
How to read this figure. Left: each point compares a professor’s publication-output rank per year and per research hour. Points off the diagonal have different ranks. Right: the ratio of those percentile ranks; it is not a ratio of output quantities. Source: Figure 4(a–b), p. 15, cropped from the paper. Click to enlarge.
What the survey adds
Professors report their salaries and sources of income, expected time use, funding, research aims, and household circumstances. Responses are linked to publication and grant records, allowing comparisons that those records alone cannot support.
What the comparisons mean
The results describe relationships among researchers’ circumstances and choices. They do not identify the effects of changing salaries, teaching loads, funding, or tenure rules. The sample covers professors at large research institutions, rather than the whole scientific workforce.
Time-adjusted output is also an imperfect measure. The analysis divides past publication output by expected future research hours. It can reveal differences hidden by annual counts, but does not measure the causal return to another hour of research or all forms of research value.
Source: published February 19, 2026 article, Sections 2–3 and Figure 4. This summary uses the published version, rather than the 2023 arXiv draft linked on the research page. Full paper.
Questions about the paper
How representative the survey is, what common metrics miss, and which policy conclusions require further evidence.
Can a survey with a 3.33% response rate represent academic researchers?
The low response rate makes selection a concern. The paper compares respondents and nonrespondents using institutional funding, grants, and publications, finding broadly similar observable characteristics, with under-response from medical schools. Recruitment incentives and reminders provide further checks. These comparisons cannot rule out differences in unobserved preferences or circumstances. The intended population is professors at large U.S. research institutions, not all researchers. See Section 2, pp. 4–8.
Does output per research hour give funders a better productivity measure?
It addresses one problem: two professors may publish different amounts because they have different amounts of research time. But reported hours contain error, past publications are paired with expected future hours, and publications miss some outputs. The ratio also says little about what an additional grant would produce. It is useful for checking annual-output rankings, rather than a ready-made funding rule. See Section 3.2 and Figure 4, pp. 14–15.
Do the earnings results show that universities fail to reward productive research?
Observable research output explains relatively little of earnings variation, while institutions, ranks, tasks, and sources of income explain much more. That does not establish that compensation is inefficient. Professors do work beyond publishing, and the data do not measure every contribution or the contracts they face. The regressions describe earnings differences; they do not estimate the payoff to causing someone to publish another paper. See Section 3.1, pp. 9–14.
Does more fundraising make researchers choose safer projects?
Fundraising time is related to reported research risk, but this paper does not establish the direction of causation. Funding conditions could influence project choice, researchers could seek funding suited to their projects, or both could reflect other circumstances. Personal risk-taking and whether research generates or tests hypotheses also help predict reported risk. These patterns motivate further study rather than identify a policy effect. See Section 3.2 and Figure 5, pp. 16–17.
Can the survey tell us how tenure or aging changes research behavior?
It compares people at different ages and career stages at one point in time. Older professors report different time allocations and intended outputs, while intended audiences vary less. Those differences may reflect career changes, differences between generations, or who remains in academia. They do not isolate the effect of receiving tenure or getting older. See Section 3.3 and Figure 6, pp. 18–19.
What can policymakers and researchers do with these data?
The survey can help describe how funding, work responsibilities, income, and research aims differ across groups. It can also identify questions worth testing with a policy change or follow-up data. An anonymized dataset is publicly available, but users should check which variables it contains and retain the survey’s limits on population coverage and causal interpretation. See the paper’s data availability statement and data link.