Productivity Beliefs and Efficiency in Science
AI-generated summary. The summary and Q&A on this page were generated by AI, with limited human editing. Please refer to the paper for the full results and interpretation.
The paper in brief
How research resources are allocated can affect scientific output.
Researchers differ in how much salary they would give up for research funding or fewer administrative duties. This paper uses those choices and a model of research work to estimate differences in expected productivity. Its calculations suggest that reallocating existing funding and research time could produce substantial gains, under the model’s assumptions.
10 cents per $1
Median stated willingness to give up salary for additional research funding.
$68 per hour
Median stated willingness to pay for one fewer hour of administrative duties.
+63%
Increase in valued research output under the model’s ideal reallocation of existing resources.
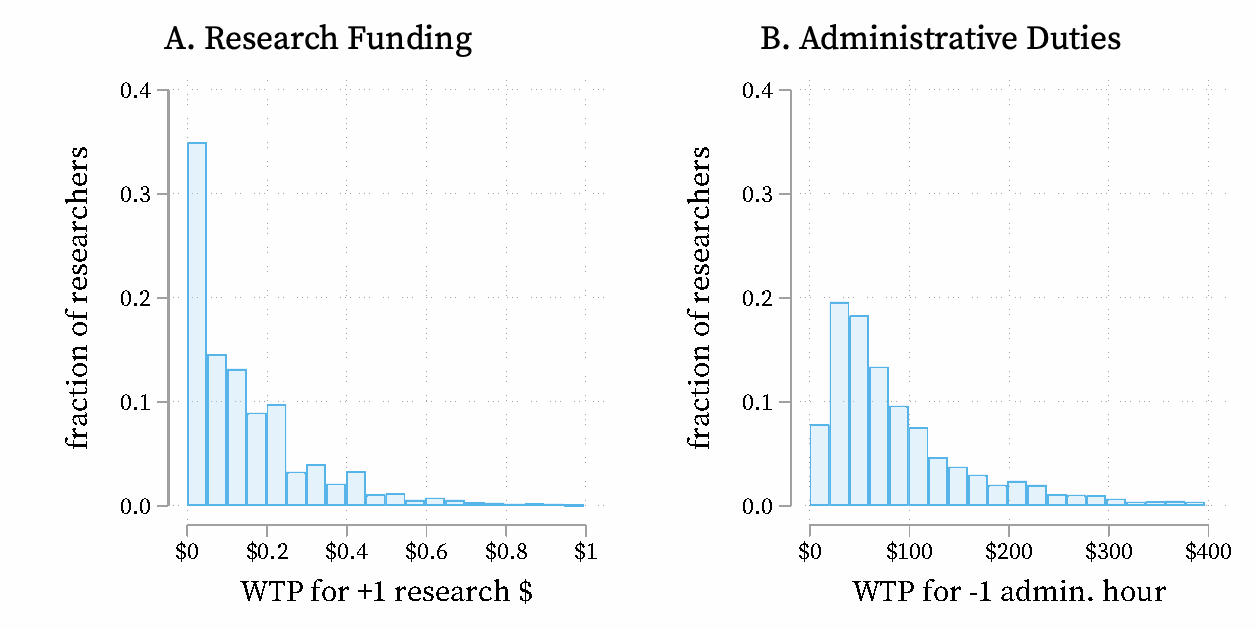
How to read this figure. The horizontal axes show salary researchers would give up for $1 more in funding or one fewer administrative hour. The vertical axes show the share of respondents. These are stated preferences, not observed salary trades. Source: Figure 1, PDF p. 21, cropped from the paper. Click to enlarge.
What the study measures
Professors at major U.S. research institutions consider hypothetical changes to salary, funding, and administrative duties. The model uses their answers, time use, and funding to separate productivity beliefs from differences in preferences and constraints.
What the allocation exercise does
The ideal benchmark reallocates funding and research time within groups defined by field and career stage, holding each group’s totals fixed. It assumes a planner can assign resources directly. It does not evaluate a specific grant program.
The gains are model-based estimates. The method measures beliefs about future productivity, not realized returns to new grants. Hypothetical answers and model assumptions affect the estimates; the authors interpret the gains as plausible upper bounds.
Source: March 2026 draft, Sections 4–6 and Table 3. The 63% figure concerns valued output; the corresponding increase in the model’s welfare measure is 2.9%. Full paper.
Questions about the paper
What the model identifies, how to interpret the gains, and what a funder could do with the results.
Why should willingness to give up salary reveal productivity?
A researcher who expects resources to generate more valuable research may be willing to give up more salary to obtain them. But salary, preferences, and existing resources also affect that choice. The model explicitly accounts for those factors before using the remaining differences to infer productivity beliefs. The result depends on that model; willingness to pay alone is not a productivity ranking. See Section 2, PDF pp. 7–14.
Could the estimates mainly reflect confidence or hypothetical answers?
The method measures researchers’ expectations, so mistaken beliefs could affect the results. The paper checks whether answers move with wages and funding needs, compares model-based output with citation measures, and examines response noise and survey selection. Those checks support the approach, but cannot establish that each person’s beliefs match their future productivity. See Sections 4–5, PDF pp. 18–25.
Does a 63% output gain mean a funding agency could raise output by 63%?
It is an ideal benchmark. The model lets a planner assign both funding and research time directly, using information a real agency would not fully observe. The 63% is a change in the model’s valued-output measure, not a forecast of additional papers or the effect of an implementable reform. The model’s welfare gain is smaller because welfare also includes researchers’ consumption and leisure. See Section 6.2 and Table 3, PDF pp. 28–30.
Do the findings favor concentrating grants on a few researchers?
The ideal allocation in this model actually narrows the distribution of funding and research time. Current resources already tend to go to researchers with higher estimated productivity, but some large differences in inputs are not justified by the model’s estimated returns. This is not evidence that every researcher should receive the same grant, or that concentrating funding is always inefficient. See Figure 4 and Section 6.2, PDF pp. 28–30.
Could funders identify who should receive more resources using existing records?
Only to a limited extent in this analysis. Standard features such as career position, background, and publication records explain relatively little of who is over- or under-resourced according to the model. That makes translating the estimated gains into a workable allocation rule a separate problem. The paper does not provide a validated scoring system for individual grant decisions. See Section 6.4, PDF pp. 34–36.
What is the practical policy implication?
The results give a reason to study how funding access and research time are distributed, alongside how much is spent. A benchmark that equalizes funding opportunities within field and career-stage groups captures a substantial share of the ideal welfare gain in the model. Whether a real reform achieves those gains requires evidence about its allocation decisions, costs, and researchers’ responses. See Section 6.3, PDF pp. 31–33.